Measuring wood with a camera
Bundles of sliced veneer ride a conveyor past a camera at constant speed. By the time each one reaches the end of the belt, we want its length, its width, and an honest account of how far from rectangular it is. This is the vision pipeline that does it — C# on .NET 10, EmguCV over OpenCV 4.13 — including the two places my first instincts were wrong.
Sliced veneer is sold by area. A bundle of it — a stack of paper-thin sheets, clipped square-ish at both ends — has a length and a width, and multiplying those two numbers by the sheet count is most of what a grading ticket needs. Measuring by hand works fine until you want every bundle measured, consistently, at line speed, and recorded.
So: put a camera over the conveyor. That part is easy. The rest of this post is about everything that is not easy, which turns out to be almost all of it, and almost none of it in the places I expected.
The measurement problem is almost entirely a deciding what counts as the bundle problem. The geometry, once you have a clean silhouette, is the easy half.
Wood is not a manufactured part. It is dark or light depending on the species, it has fibres hanging off it, sheets flip up, corners tear, and the edges are wavy at the millimetre scale because they were cut from a tree.
The image is not a photograph
The first thing that shapes everything downstream: the image the algorithm measures is not a single frame from the camera. The bundle is moving, and it is much longer than the camera's field of view along the direction of travel. So each frame gets cropped to a narrow strip across the belt, and the strips are stacked in order as the bundle travels through. The result is one tall image, assembled a row-band at a time.
This has a consequence that took me an embarrassingly long time to appreciate. The image has two different scales, and only one of them is optics. Across the belt, millimetres-per-pixel is what you would expect: lens, sensor, mounting height. Measure it once, it holds. Along the belt, one image row is one frame of belt travel, so the vertical scale is belt speed divided by frame rate. Change either — retune the line, bump the target frame rate, adjust the crop — and every length measurement is silently wrong by the ratio.
What that means for calibration
You cannot calibrate this from a still photograph of a target. The calibration target has to be built like a bundle and sent down the belt, so the assembled image has the same geometry a production bundle gets. Mine is a checkerboard on a rigid board, matte finish — gloss glares under line lighting and ruins corner clicks — mounted at the height of a typical bundle top, because pixels-per-millimetre changes with distance to the camera and a 20 mm height error is a 1–2 % scale error at typical mounting distances.
The wizard that drives it samples both axes from clicked checkerboard corners, averages the samples, and reports the spread. If the samples near the top of the image disagree with the samples near the bottom, that is not optics — that is the strips stacking unevenly, which is belt speed versus frame rate telling you something.
Eleven stages, and where each one earns its keep
Here is the whole pipeline before we go into the interesting parts. Input: one grayscale image. Output: a measurement record, or null — which is itself a real answer, and one I will come back to.
Stages 1–4 find the wood, 5–8 decide what part of it is the bundle, 9–11 measure it. The whole thing is a pure function of an image and an options object: no UI, no database, no camera. That is the single design decision I would defend hardest, because it is what makes any of the rest of this post possible to verify.
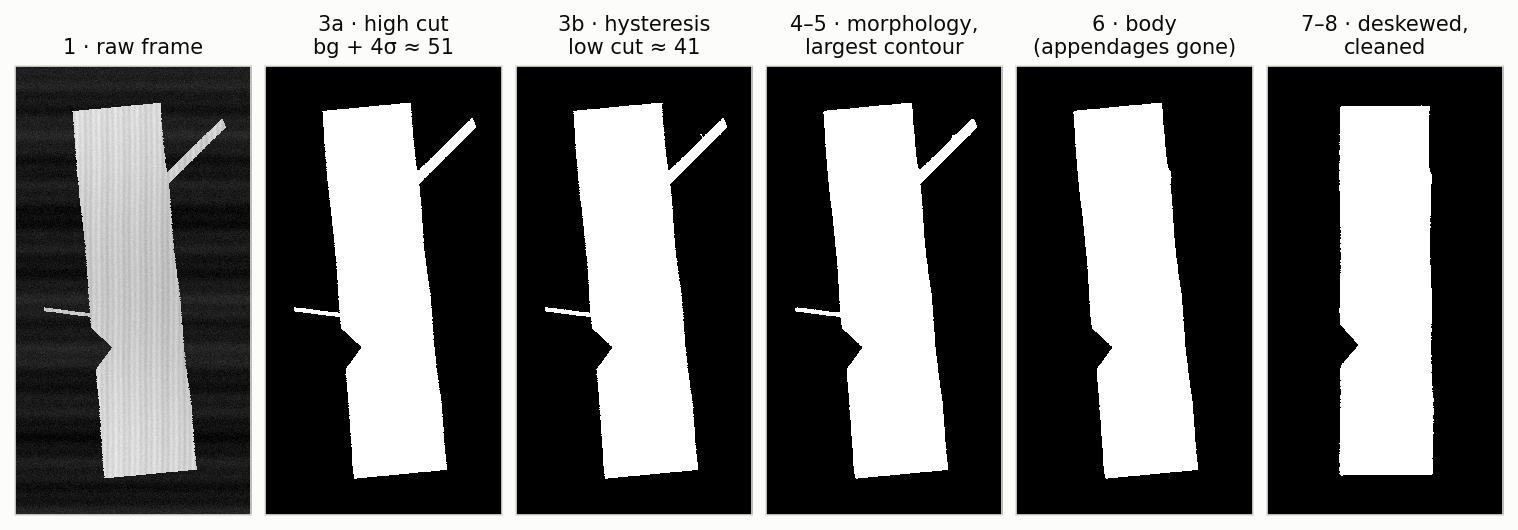
Every bundle image in this post is synthetic, drawn from known geometry so the right answer is known by construction. That is also how the test suite works.
The threshold problem, and why Otsu was the wrong reflex
Segmentation looks trivial here: dark belt, bright wood, pick a threshold. My first version used Otsu's method, which is the standard reflex — it finds the split that best separates the histogram into two classes, no tuning required. It worked beautifully on maple. It fell apart on walnut.
The problem is that Otsu's split moves with the bundle. It is a property of the whole histogram, so it depends on how bright the wood is and on how much of the frame the wood covers. For a large, mid-grey bundle it drifts upward toward the wood. And the version that bit me was worse than that: I was estimating the background statistics from "everything below the Otsu split", then setting the foreground cut at background + 4σ. Once the split moves into the wood, the pixel set you are calling "background" contains wood, its variance inflates, and the cut you derive from it climbs — chasing the very thing it is supposed to separate.
The fix is to anchor to the one thing in the frame that never changes. The conveyor is a stable dark peak in the intensity histogram. Find that peak directly, take the mean and spread of a band around it, and set the cuts from those:
high cut = background + 4.0 · σ      // the confident core
low  cut = background + 2.5 · σ      // the growth threshold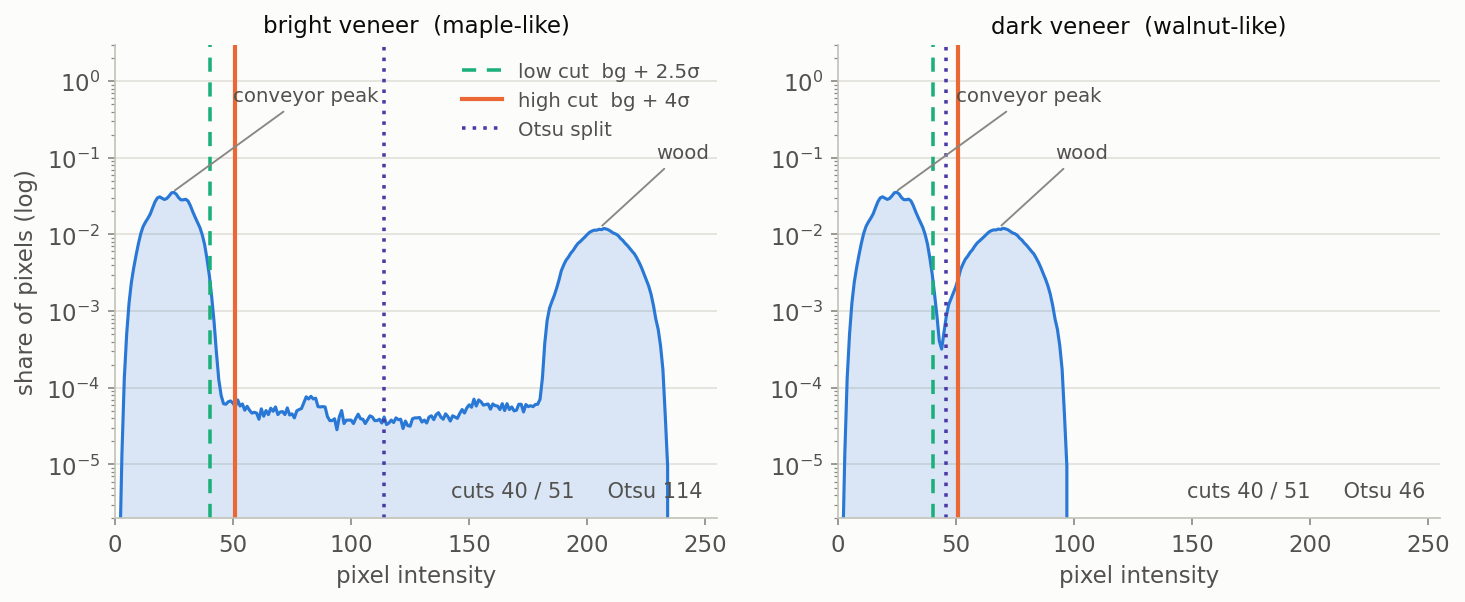
The anchored cuts are identical in both panels — 40 and 51 grey — because the conveyor peak they are measured from has not moved. The Otsu split travels from 114 to 46 across the same two frames. Note where 46 lands on the right: inside the wood mode's own dark tail.
I wanted to know how much this actually buys, so I swept synthetic bundles across the whole plausible veneer brightness range — mean wood intensity 50 to 215 grey — and measured how far each estimator's threshold wandered.
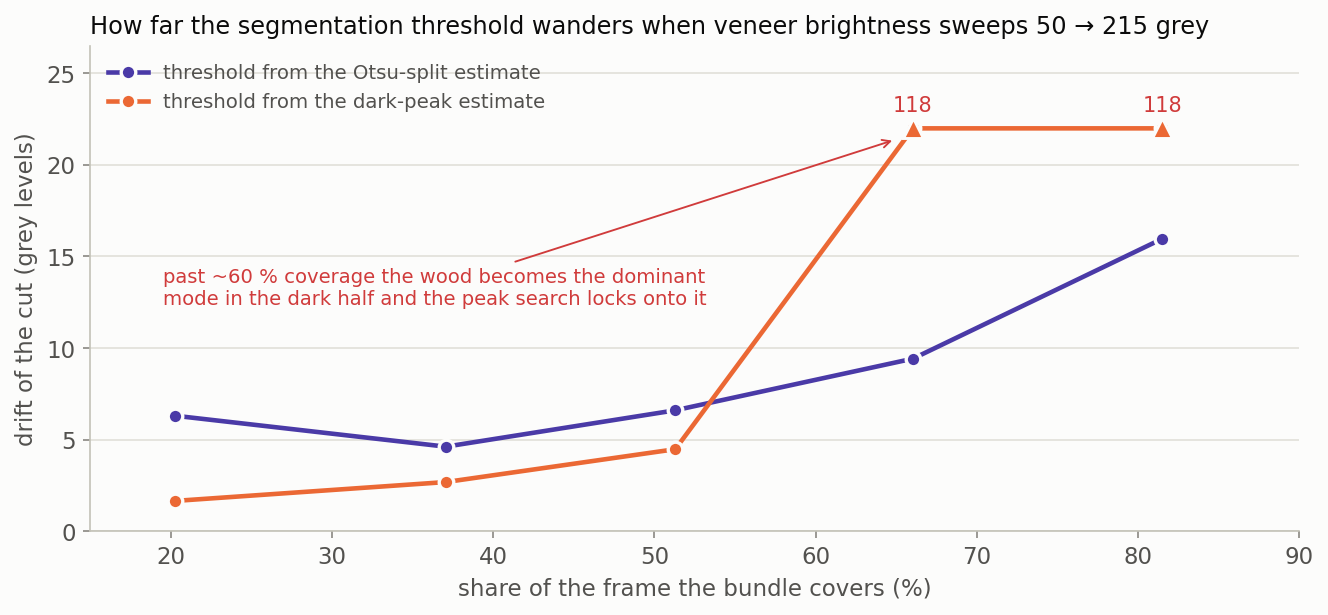
The Otsu-derived cut drifts more as the bundle fills more of the frame, which is exactly the mechanism: more wood below the split means a more contaminated "background". The dark-peak estimate is flat to within a few grey levels — and then does something I will come back to at the end, because I did not know about it until I drew this chart.
A word on honesty here, because it matters for how much you should trust the rest of this post. On my synthetic frames the drift is real but modest — six to sixteen grey levels — and I could not make the old estimator produce the catastrophic speckled masks I actually saw in production. Real veneer has a much broader intensity spread than anything I am willing to draw by hand: figure, mineral streak, dark end-grain, glue lines. The mechanism in the chart is the mechanism that broke it; the magnitude in the chart is the floor, not the ceiling. I would rather say that than tune a synthetic image until it agrees with me.
Hysteresis: two thresholds instead of one
Having two cuts instead of one is the other half of the segmentation. A single threshold forces an impossible choice on the clipped ends of a bundle, where you get dark end-grain: set the cut low enough to keep the end-grain and you also admit the conveyor's brightness banding; set it high enough to exclude the banding and you lose the end.
Hysteresis dissolves the choice. Keep every pixel above the low cut that belongs to a connected component containing at least one pixel above the high cut. The confident core grows outward along connected wood; disconnected banding that crept above the low cut has nothing to attach to and is dropped.
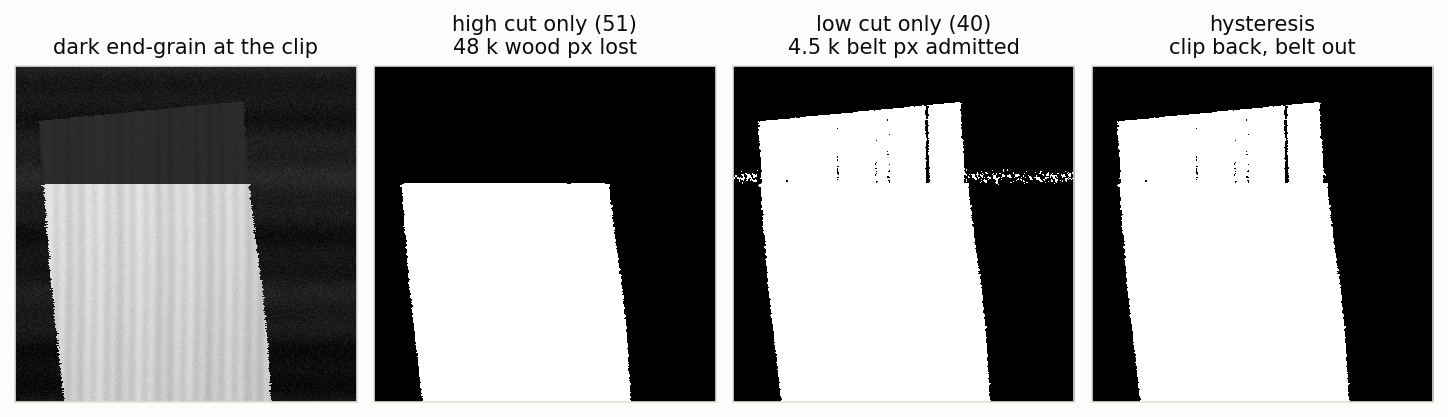
With the end-grain band darkened to about a fifth of the wood's brightness, the high cut alone loses roughly 48 k wood pixels and shreds the clip into vertical stripes, which would put the measured end wherever the stripes happened to fall. The low cut alone recovers the clip but admits about 4.5 k belt pixels.
Cost: one connected-components pass over the low-cut mask plus a lookup per pixel. On a multi-megapixel assembled frame that is the single most expensive early stage, and it is worth every millisecond.
What counts as the bundle
Now the part I had underestimated most. A real bundle arrives with things attached to it that are unambiguously not part of its dimensions:
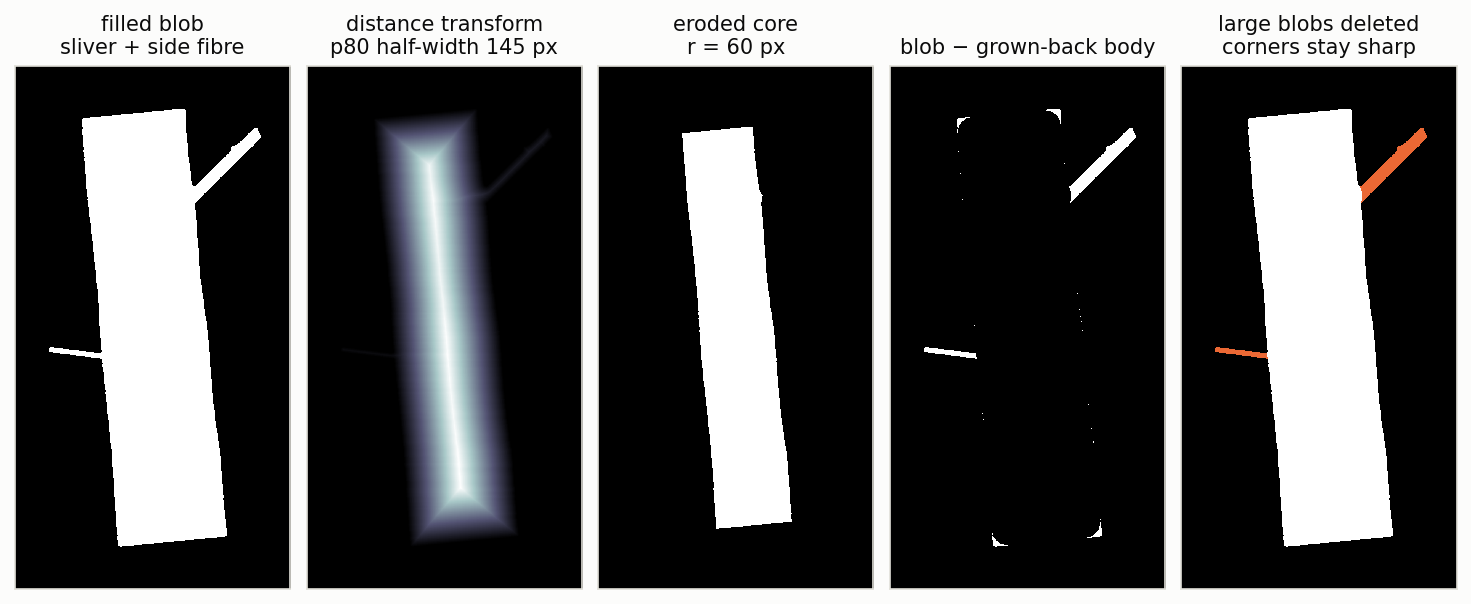
- a sliver — a long thin offcut lying against the side, still touching
- a loose fibre sticking out sideways
- a crossed-fibre "X" across the face
- a sheet flipped up off one end, sitting proud of the clip
Every one of these is connected to the blob, so the largest-contour step happily includes them. And here is the trap: the natural instinct is to deal with them after straightening the bundle, because per-row logic on an upright silhouette is easy to reason about. That instinct is wrong, and it is wrong in a way that is invisible until you look for it.
Orientation comes from the minimum-area rectangle of the silhouette. A diagonal sliver is part of that silhouette. So the sliver rotates the deskew itself — and after that, every per-row measurement is being taken along the wrong axis. You cannot clean up a bundle in a frame of reference the mess helped define.
One synthetic bundle, tilted −5.03°, with a diagonal sliver added. Body extraction runs before the deskew, and turning it off is the only change between the two rows:
| Body extraction | Reported tilt | Widest row | Median width | Rectangularity |
|---|---|---|---|---|
| on | −5.03° | 396 px | 386 px | 0.96 |
| off | +4.83° | 586 px | 393 px | 0.55 |
A 9.9° error in orientation, a widest-row measurement inflated by 48 %, and a rectangularity score that has stopped describing the bundle at all. Note that the median width barely moves — which is the good news about robust statistics and also exactly why this bug can hide for a long time behind a headline number that looks fine.
Stripping appendages without rounding the corners
Appendages are thin. That is the only property they reliably share, and it is enough. A morphological opening — erode away everything thinner than some radius, then grow the survivor back — severs them cleanly. Two details make it work on real bundles rather than just in principle.
First, the radius has to come from the bundle itself. A fixed pixel radius is wrong for a bundle twice as wide, and wrong in the other direction for a narrow one. So: distance-transform the filled blob, take the ~80th percentile of the distance values as a robust half-width, and erode by 0.6 × that, floored at 10 px and capped at 60 px so a wide bundle does not cost a fortune and a genuinely thin one does not get erased. That shaves anything under roughly 0.8 × body width and scales with whatever comes down the belt.
Second — and this is the bit I got wrong first — you must not replace the mask with the opened shape. Opening rounds corners. A bundle's clipped ends have real, sharp corners, and rounding them shortens the measured length by tens of pixels on every single bundle. A systematic bias applied to every measurement is far worse than an occasional outlier.
So the opened shape is never the output. Instead: take the difference between the original blob and the grown-back body, and delete only the large connected components of that difference from the original mask. Corner rounding produces a scatter of tiny slivers, under about 800 px² at the default cap; genuine appendages run into the tens of thousands. Threshold between them — 0.4 % of the blob, floored at 1500 px² — and a clean bundle comes out byte-identical to what went in, corners intact.
The false sheet, or: two shapes that look identical for 100 rows
One case survives all of that, because it is not thin. A veneer sheet flipped up past a clipped end can be half the bundle's width — too chunky for the erosion to sever. On the upright silhouette it is a narrow prefix that steps up to full width.
The trouble is that a legitimately chamfered or rounded end is also a narrow prefix that reaches full width. Trim it and you eat 25–50 px of real veneer off every bundle produced with that clip geometry.
What separates them is not width, or length, or where they start. It is the derivative. A flipped sheet is a sheet — roughly constant width along its whole length, then a step. A chamfered end climbs steadily across the same rows, measured at 1.6–4.3 px of width per row on real bundles. So the test is a slope: median width over the prefix's outermost fifth versus its innermost fifth, checked both as a per-row slope, which must stay under 0.5 px/row, and as a total rise, which must stay under 15 % of body width — because a steep ramp that starts already close to the cut has a short prefix and so a deceptively small total. Then the neck: full width has to arrive within a few percent of the bundle's length, or it is a gradual taper and gets left alone.
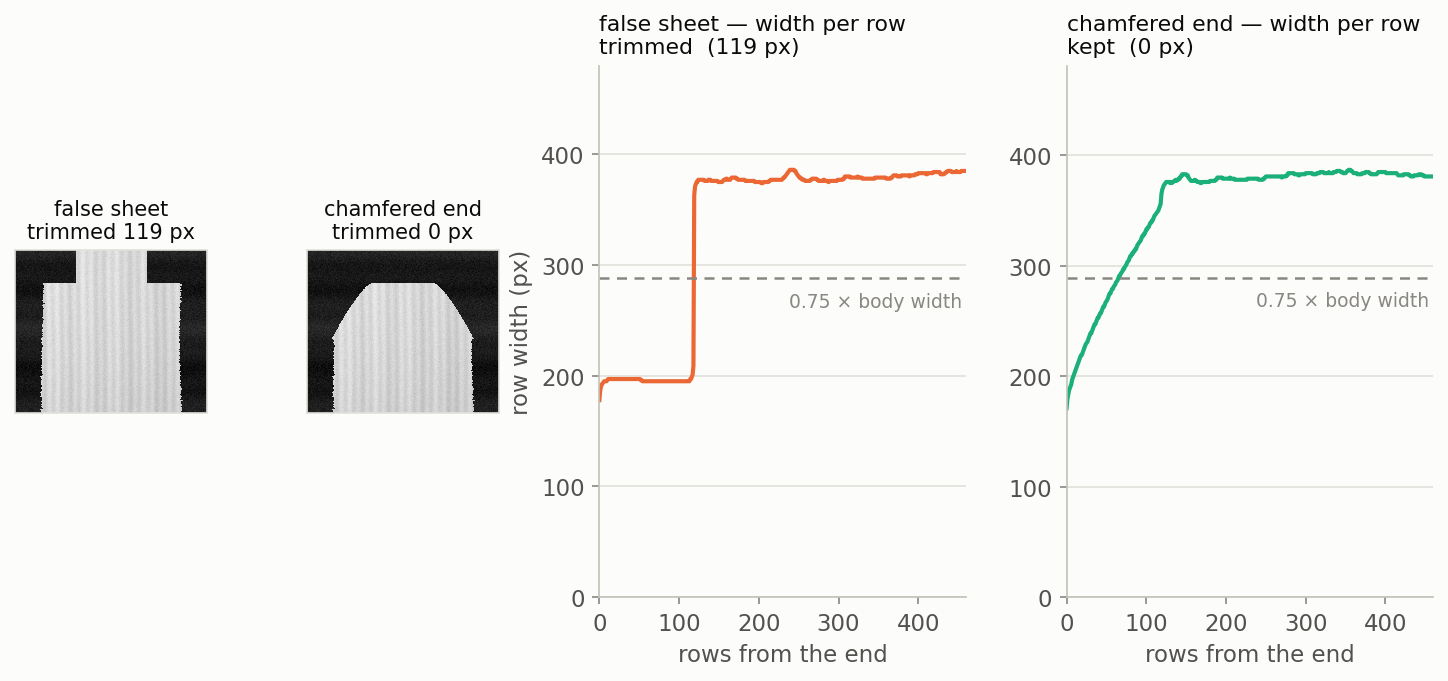
Being wrong here is asymmetric, which is worth saying out loud: failing to trim a false sheet overstates one bundle's length. Wrongly trimming chamfered ends understates every bundle's length, forever, until someone notices. The parameters are deliberately biased toward leaving ends alone.
Fitting straight lines to something that is not straight
With a clean upright silhouette, geometry time. And the temptation is to just take the bounding box — but a bundle is not a rectangle. The ends are clipped at slightly different angles, the sides converge a little, and the long edges are wavy, because they are wood.
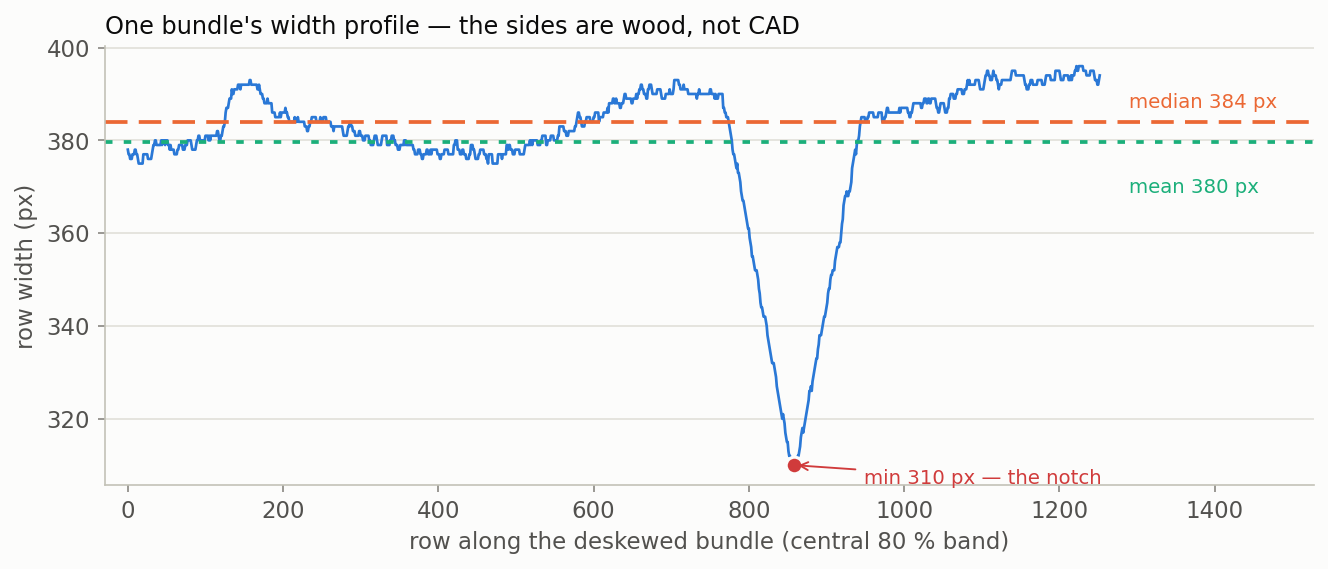
Look at the two horizontal lines on that chart: the notch drags the mean 4 px below the median. That gap is the entire argument for which statistic gets reported, and it is why the pipeline emits seven different width figures rather than one.
So the model is a trapezoid, fitted rather than measured. Sample the leftmost and rightmost foreground pixel of each row and the topmost and bottommost of each column, over the central 80 % only — the outer 20 % is where clipped corners live and they would drag every fit. Then fit four lines and intersect them for the corners.
A least-squares fit alone will not do, because the notch in that chart is a real feature of a real bundle and it is 74 px of pure leverage on the line it touches. So each edge gets MAD outlier rejection first — median absolute deviation, 3σ, with a floor of 2 % of the bundle's span so a suspiciously clean edge cannot produce a zero-width tolerance and reject everything.
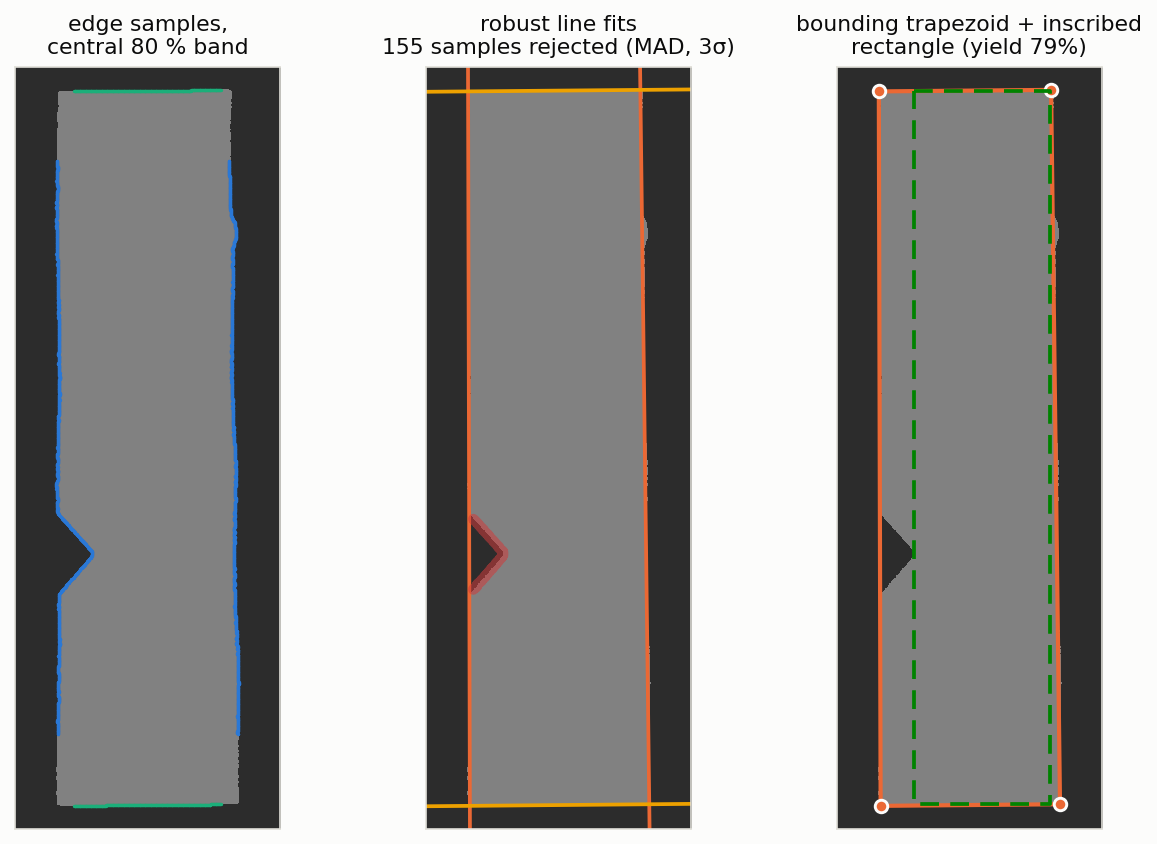
Crucially, the deviation those rejected samples represent is still reported: it is thrown out of the line fit, not thrown away. Max edge deviation on this bundle is 74 px, and that number is part of the output.
Not one rectangularity number, several
"How rectangular is it" turns out to be several independent questions, and collapsing them into one score loses the information a grader actually wants. So the record carries a headline plus the decomposition — measured here on the notched synthetic bundle from the figures above:
| Metric | What deviation it isolates | Value |
|---|---|---|
| Rectangularity | everything at once — area ÷ min-area-rect area | 0.949 |
| Trapezoid fit | how well straight sides model it (IoU with the fit) | 0.978 |
| Taper ratio | narrower end ÷ wider end — sides not parallel | 0.960 |
| Side convergence | angle between the two long sides | 0.57° |
| Clip parallelism | angle between the two end clips | 0.01° |
| Left / right edge RMS | organic waviness, per side | 16.8 / 2.8 px |
| Max edge deviation | the worst single bite — notches, protruding tags | 74.0 px |
| Rectangular yield | largest inscribed rectangle ÷ bundle area | 0.786 |
Read that table as a diagnosis rather than a score. Rectangularity 0.95 sounds fine. Clip parallelism is essentially perfect and taper is mild, so the ends and the sides are not the problem. But the left edge's RMS is six times the right edge's, and max deviation is 74 px — one side got damaged. And the yield says that only 79 % of this bundle's area survives as a clean rectangle, which for a product sold by usable area is arguably the most actionable number on the list.
That last one is my favourite piece of the pipeline for how cheap it is. The largest all-foreground axis-aligned rectangle in a binary mask is exactly the classic largest-rectangle-in-a-histogram problem, one row at a time: maintain a per-column run-height array, and for each row run the monotonic-stack scan. Linear in pixels, about thirty lines, and because it runs on the deskewed mask the rectangle it finds is aligned to the bundle's own axis rather than the camera's.
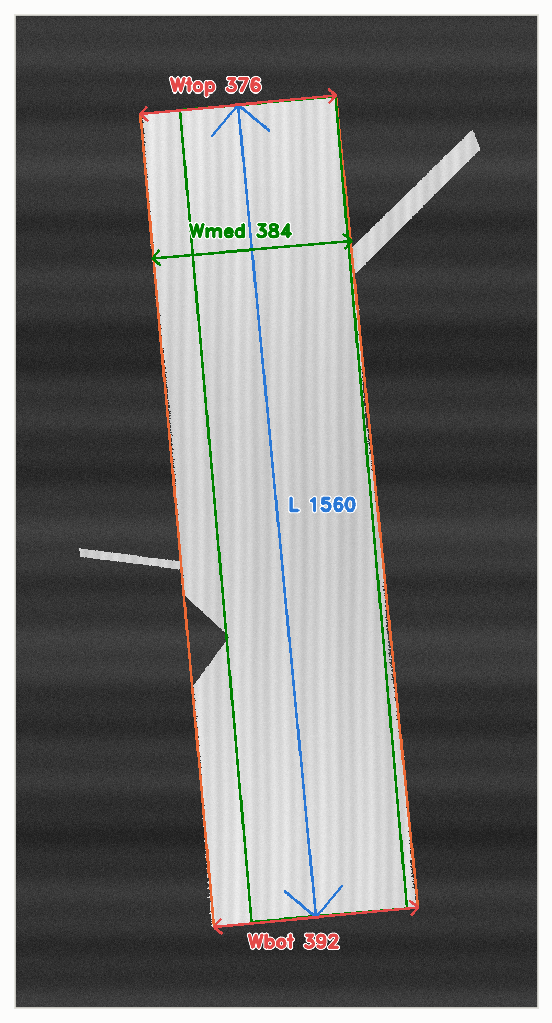
This view is the one that has caught the most bugs, by a wide margin. A wrong number looks fine on a screen; a wrong arrow is obvious in half a second. Note that the sliver and fibre are still visible in the frame and correctly excluded from every measurement.
Does it actually measure?
Every bundle image in this post was drawn from known geometry, which means the expected answer is known too. That is the test strategy: synthetic bundles, expectations by construction, no camera and no database needed to run the suite.
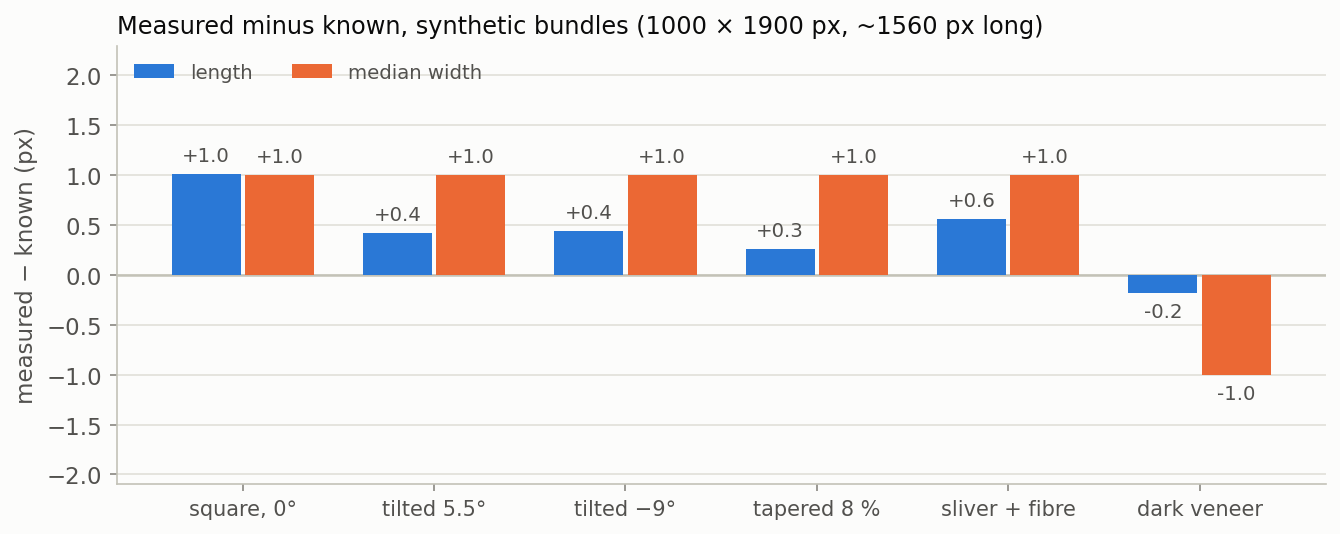
Tilt costs nothing measurable, which is the deskew doing its job. The appendage case matches the clean case, which is body extraction doing its job.
What that does and does not prove
It proves the geometry, the deskew, the fitting and the cleanup are correct — that the algorithm measures what it thinks it is measuring. It proves nothing about the physical chain: optics, lighting, belt speed, strip stacking. Those only get verified end to end, by sending a board of accurately known dimensions down the line as a normal bundle and comparing. Aim within ±0.5 %. That check is the only one that exercises everything, and it is the one to repeat whenever the numbers start looking strange.
Rejecting a frame is a feature
A measuring system that always returns a number is worse than one that sometimes declines. Four conditions make the pipeline return nothing:
- Nothing big enough. Largest blob under 1 % of the frame — an empty belt or a stray fleck never becomes a "bundle".
- Too few edge samples survive the fits. If MAD rejection leaves under two points on any edge, the trapezoid would be a guess dressed as a measurement.
- A degenerate bounding box. Non-finite width, height or angle would seed the rotation matrix with NaNs and hand them to native code.
- A runaway capture. A frame ≥ 32 767 px tall means the strip assembler never saw the bundle end. It is also the deskew's hard limit — OpenCV builds its interpolation map in 16-bit signed coordinates and asserts above that, which surfaces through the managed wrapper as a bare
SEHExceptioncarrying no detail whatsoever. Checking the dimensions up front turns a mystery crash into a log line.
There is a related output that is not a rejection but is nearly as important: a flag for which frame edges the bundle touches. If it runs off an end, the reported length is a lower bound, and the record says so rather than quietly reporting a short bundle. Interestingly, this interacts with the false-sheet trim — a flipped sheet can itself reach the frame edge, so the truncation flag can only be finalised after trimming has run, because trimming is what proves the real end was found.
The thing I found while writing this post
Look again at the orange line in the drift chart. Flat, flat, flat — then 118 grey levels.
The background estimator searches for the dominant histogram peak in a fixed dark range, 10–140 grey, on the assumption that the conveyor is the dominant mode there. That assumption holds while the belt is most of the frame. Past roughly 60 % bundle coverage, with mid-grey wood, the wood becomes the dominant mode inside that search window — and the peak search locks onto the bundle instead of the belt. The threshold then lands inside the wood, which is precisely the failure mode the whole design was meant to eliminate. Same bug, different door.
I have not seen this on the line, because bundles do not fill that much of the assembled frame with the current crop. But "has not happened yet" is a property of the current configuration, not of the algorithm, and the configuration is exactly the sort of thing that gets adjusted by someone who was not in this conversation. The honest fix is not to widen the search window — it is to stop relying on "dominant" and use spatial information instead: the belt is the stuff around the edges of the frame, and it stays the belt regardless of how much wood is in the middle.
That is the next thing I will change, and I only found it because I sat down to draw a chart of something I already believed was solved. Which is, I think, the actual argument for writing these things up.
The parameters, and what each one trades
Every tuning knob in the pipeline, with the reasoning rather than just the number — because a default with no rationale attached is a default nobody can safely change. Defaults are the shipped values, and every one of them is a trade, not a truth.
| Parameter | Default | What moving it costs you |
|---|---|---|
| Background σ (high cut) | 4.0 | Lower admits belt banding; higher starts losing dark end-grain. |
| Low background σ (growth cut) | 2.5 | Set equal to the high cut and hysteresis is disabled. Lower and disconnected banding gets more chances to touch the core. |
| Morphology kernel | 15 px | Bridges gaps and drops specks; also the main source of a few px of edge motion. |
| Min area fraction | 1 % | The empty-belt gate. Too high and a genuinely small bundle gets refused. |
| Body erosion fraction | 0.6 × half-width | Shaves anything under ~0.8 × body width. Higher removes chunkier appendages but rounds the body more. |
| Body erosion cap | 60 px | Bounds cost on wide bundles and protects genuinely thin ones from being erased. |
| Appendage min size | 0.4 %, floor 1500 px² | The line between "real appendage" and "corner rounding". Too low and the body's own corners get deleted. |
| False-sheet max slope | 0.5 px/row | Resolution-independent, being a ratio of lengths. Raise to trim aggressively; lower to protect rounded ends. |
| False-sheet max rise | 15 % of body width | Catches a long prefix that ramps gently enough to pass the slope test. |
| Central band | 80 % | Excludes clipped corners from the edge fits. Wider re-admits them; narrower starves the fits of samples. |
| Edge outlier σ | 3.0 (MAD) | Tighter starts rejecting genuine waviness and reports a bundle straighter than it is. |
A note on the figures
Every image and chart here was generated from synthetic bundles by a Python/OpenCV port of the production pipeline, running against OpenCV 4.13 — the same version the .NET application uses through EmguCV. No production imagery, no customer data, no real measurements. Numbers quoted from those figures are measurements of the port on synthetic input, and where I have cited behaviour observed on real bundles I have said so explicitly.
BundleGrader is an internal application at the Freeman Corporation. Written up here for the engineering, not the business — nothing in this post describes the production configuration, the data schema, or anything a competitor would find useful.